Introduction to Airtable
Airtable is a powerful, flexible database tool that combines the simplicity of a spreadsheet with the advanced functionality of a relational database. It allows users to organize, store, and manage data efficiently while enabling collaboration across teams. Each base in Airtable acts as a workspace containing tables, which hold structured data similar to spreadsheets. However, unlike traditional spreadsheets, Airtable supports linked records, custom field types (such as attachments, checkboxes, and dates), and automations to streamline workflows. Users can also create forms to collect data, apply filters and views to customize how information is displayed, and set up automations to send emails, update records, or trigger actions based on predefined conditions. Whether managing projects, tracking inventory, or planning events, Airtable provides a user-friendly yet powerful way to structure and interact with data.
Bases
A Base in Airtable is like a relational database. It holds all your tables, views, forms, and automations for a project. A single base can contain multiple tables, forms and automations. In R-Ladies global team, we usually will have one base per team, to coordinate team tasks.
graph TD;

subgraph R-Ladies Workspace

subgraph RoCur Base

      subgraph Data
        NominationsTable["📑 Nominations"]
        CuratorsTable["📑 Curators"]
        ScheduleTable["📑 Schedule"]
        FollowUpTable["📑 Follow-up"]
      end

      subgraph Forms
        NominationForm["📝 Nomination Form"]
        SignupForm["📝 Curator Sign-up Form"]
        FollowUpForm["📝 Follow-up Form"]
      end

      subgraph Interfaces
        Calendar["📅 Schedule Calendar"]
        Pipeline["📌 Curator Pipeline"]
        TeamTasks["✅ Team Tasks"]
      end

end

subgraph Global Team Overview

      subgraph gtData
        gtMembers["📑 Members"]
        gtTeams["📑 Teams"]
        gtRepos["📑 Repositories"]
      end

      subgraph gtInterfaces
        gtMembersDashboard["📊 GT Dashboard"]
        gtVacancies["📌 Team vacancies"]
        gtNew["📝 Add new member"]
      end

end

end
Understanding the Core Components of Airtable
Airtable is built around four main components: Data, Interface, Forms, and Automations. Each serves a different purpose in organizing and managing information efficiently.
graph TD
A[Airtable Workspace] --o B[Base 1]
A --o C[Base 2]
A --o D[Base 3]

    B --o  B1F1[Form 1] -->|populates| B1[Table 1]
    B --o  B1F2[Form 2] -->|populates| B2[Table 2]
    B1F2 -- triggers create record automation --o B3[Table 3]

    C --o C1F[Form 1] -->|populates| C1[Table 1]
    C --o C2F[Form 2] -->|populates| C2[Table 2]

    D --o D1F[Form 1] -->|populates| D1[Table 1]
    D --o D2[Table 2]
    C2 -.-> |synced| D2
Data (Tables, Fields, and Views)
- What it is: The foundation of Airtable—where all your raw information is stored.
- How it works:
- Data is organized into tables, similar to spreadsheets.
- Each table contains fields (columns) that hold different types of data (text, dates, linked records, etc.).
- Different views (grid, calendar, kanban, etc.) allow you to filter, group, and sort the data without changing the underlying records.
- Views are made to create accessible subsets of the data to come easily back to.
- Things like filtering, grouping and sorting in Airtable are not seen as dynamic functions to run on demand. They are rather seen as tools for creating views of the data to come back to over and over.
- Example: A “Curators” table stores names, contact info, and scheduled dates. You can have a Grid View to see all records and a Calendar View to visualize the schedule. You can also create a Grid View that is only of future curators, with just a couple of necessary fields.
Interfaces
- What it is: A customizable dashboard that provides a visual and interactive way to view and interact with data. Interfaces can be shared both internally and externally.
- How it works:
- Interfaces let you create charts, summaries, and interactive views to help users navigate data more intuitively.
- Unlike tables, interfaces don’t store data — they present existing data in a user-friendly way.
- Example: A Curator Dashboard that shows upcoming schedules, curators needing follow-ups, and a quick summary of curator feedback.
graph TD
A[Airtable Data Tables] --> B{Interface Builder};
B --> C{Components Forms Lists Charts etc};
C --> D[Layout Design and Customization];
D --> E{Published Interface};
E --> F[Interface Users View and Interact];
F -- Data Input --> A;
A -- Data Display --> E;
Forms
- What it is: A way to collect new data from users without giving them direct access to the database.
- How it works:
- Forms are connected to a specific table and create new records upon submission.
- You can customize which fields are shown and add descriptions, but the form fields must match the table structure.
- Example: A Curator Signup Form where potential curators enter their name, availability, and bio. Once submitted, a new record is added to the Curators table.
Automations
- What it is: A tool for automating repetitive tasks in Airtable.
- How it works:
- Automations are triggered by specific events (e.g., “When a form is submitted”).
- They can perform actions such as sending emails, updating records, creating new records, or linking records together.
- Example: An automation that assigns a curator when they sign up and sends them a confirmation email.
How They Work Together
- Forms collect curator signups and store them in the Data table.
- The Data table (with views) organizes and tracks curators.
- Interfaces provide an overview of scheduled curators and pending tasks.
- Automations reduce manual work by sending notifications and updating statuses.
These components together make Airtable a powerful system for organizing and streamlining workflows.
Data Management
Tables & Views
Each base has Tables, which store data in a structured way.
You can create different Views of a table to organize and display data:
- Filtering – Show only specific rows based on conditions.
- Grouping – Organize data by categories, like status or date.
- View Types:
- Grid View (like a spreadsheet)
- Kanban (like Trello)
- Calendar (for date-based data)
- Gallery (for image-based records)
Each table may have many different view, as many as you like. Views are a great way to organise the underlying data into more manageable sizes for easier management. Look at views as way to create subset of the data you often want to look at. Filtering, grouping etc. in Airtable are not seen as dynamic things you do many times to inspect the data. Rather, you are expected to create views you come back to over and over again. You can also use views to sync partial data into another base, like syncing all members of the curator team into the RoCur base from the Global Team Overview base.
There are for example ways to use views when choosing linked records that create more simple data input. For instance, you might want:
- Grid view with all records and all fields
- Grid view with only completed records, with unnecessary fields hidden
- Grid view with records that are not completed, with unnecessary fields hidden
- Calendar view of all upcoming records.
Fields (Columns)
Setting the correct field type in Airtable will enable you to use data in meaningful ways in automations etc. In addition, special field types will run simple validations in a form, so that only meaningful data can be entered (like the email format makes sure what is entered is an actual email). Choosing the right field type therefore makes sure the data flow is a smooth as possible.
Some useful tips:
- Use consistent field names that are computer-friendly (avoid spaces/special characters).
- This is mostly important for bases that we pull into R for further use (like the directory and global team)
- Date fields should follow ISO format (YYYY-MM-DD) for consistency.
- Airtable by default uses US format (M/D-YY), edit the field and choose ISO format in the field editor.
- Linked Records allow connections between tables, avoiding duplicate data.
- Linked records are the most valuable feature for teams, as it reduces the need to store the same data multiple places.
- Linked records also allows you to “lookup” or “rollup” values from the linked table to populate the current table. This way you can display information from one table in another, while changes will always stay synced.
- Formula are special columns where you can run specific operations in a row-wise fashion on your data. Like calculating a date in the future based on a field, or running calculations on data.
Forms
Airtable Forms let users submit data directly into a table.
How They Work
- Forms are tied to a specific table.
- When a form is filled out, a new record is added to the table.
Best Practices
- Use clear question titles (they don’t have to match field names).
- Keep field names short and structured for better data handling.
Automations
Airtable Automations help reduce manual work by automatically performing actions.
graph TD
A[Trigger] --> B{Action};
B -- Met --> C(If Condition);
C -- Met --> D[If condition are met, then run these actions:<br>Action];
C -- Not met --> E{Otherwise, if Condition};
E -- Met --> F[If condition are met, then run these actions:<br>Action];
E -- No conditions met --> G[If no condition are met, then run these actions:<br>Action];
D --> H{{End of automation<br>run}};
F --> H;
G --> H;
Triggers (What Starts an Automation?)
There are many types of triggers for automations, you can create extremely complex custom conditions, or run on a schedule.
** Examples**
- When a record is created or updated.
- When a form is submitted.
- On a scheduled time (e.g., every Monday).
- When date in a table field is a week from now and the email field is not empty.
Actions (What Can Automations Do?)
- Send emails (notifications, reminders).
- Update records (change a status, update a date, or link to another record)
- Create new records (automate data entry).
- Run script: allows us to write custom JavaScript to do special actions.
Extending Airtable with Extensions
Airtable’s functionality can be significantly enhanced through the use of Extensions. These are additional tools and applications that you can add to your bases to perform a wide variety of tasks, from visualizing your data in new ways to automating complex workflows and integrating with other services. Extensions allow you to customize your Airtable experience to meet your specific needs and go beyond the core features of tables, forms, interfaces, and automations.
Types of Extensions
The Airtable Marketplace offers a diverse range of extensions, catering to various needs. Some common types include:
- Data Visualization: Create charts, graphs, timelines, and other visual representations of your data directly within Airtable.
- Bulk Actions: Perform actions on multiple records simultaneously, such as updating fields, deleting records, or generating documents.
- Integrations: Connect your Airtable base with other tools and platforms you use, such as Google Workspace, Slack, Jira, and more, to streamline workflows and data sharing.
- Scripting: Write custom JavaScript code to perform complex calculations, data transformations, or automate specific actions that are not available through standard automations.
- Document Generation: Create customized documents (like reports, invoices, or contracts) using the data in your Airtable base.
- Data Cleaning and Enrichment: Tools to help you standardize, validate, and enrich the data within your tables.
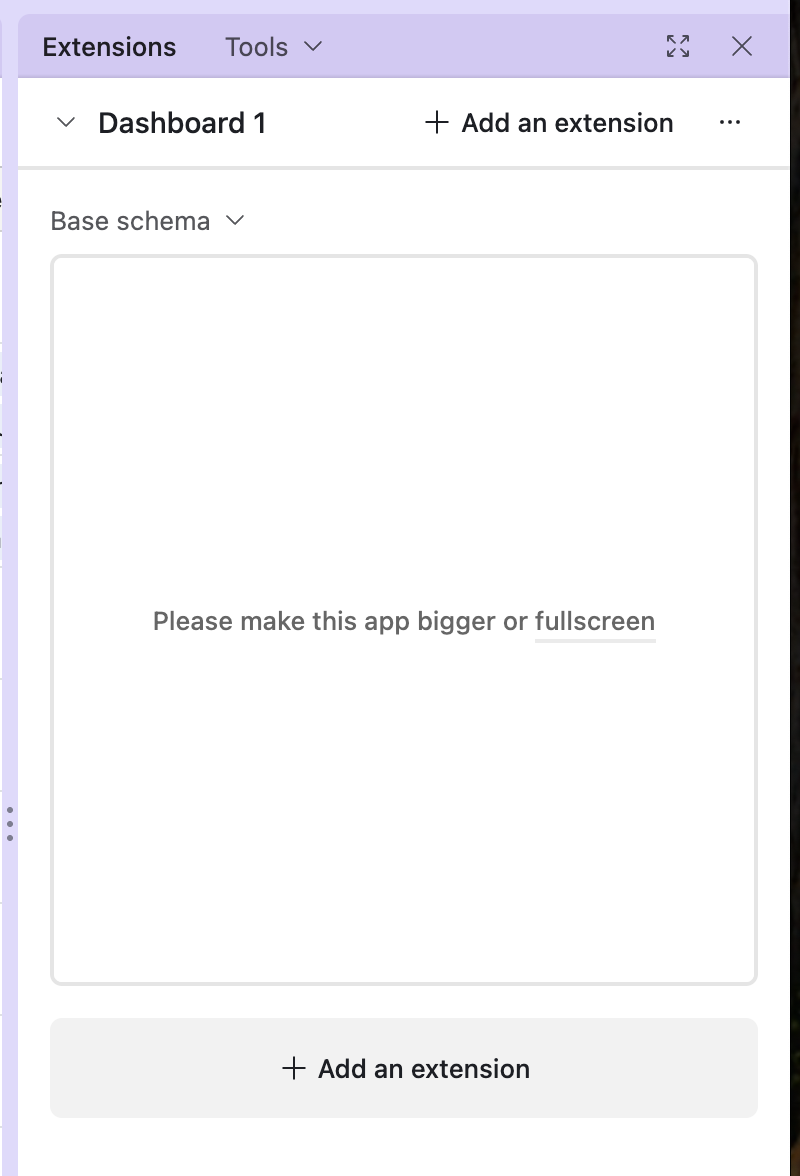
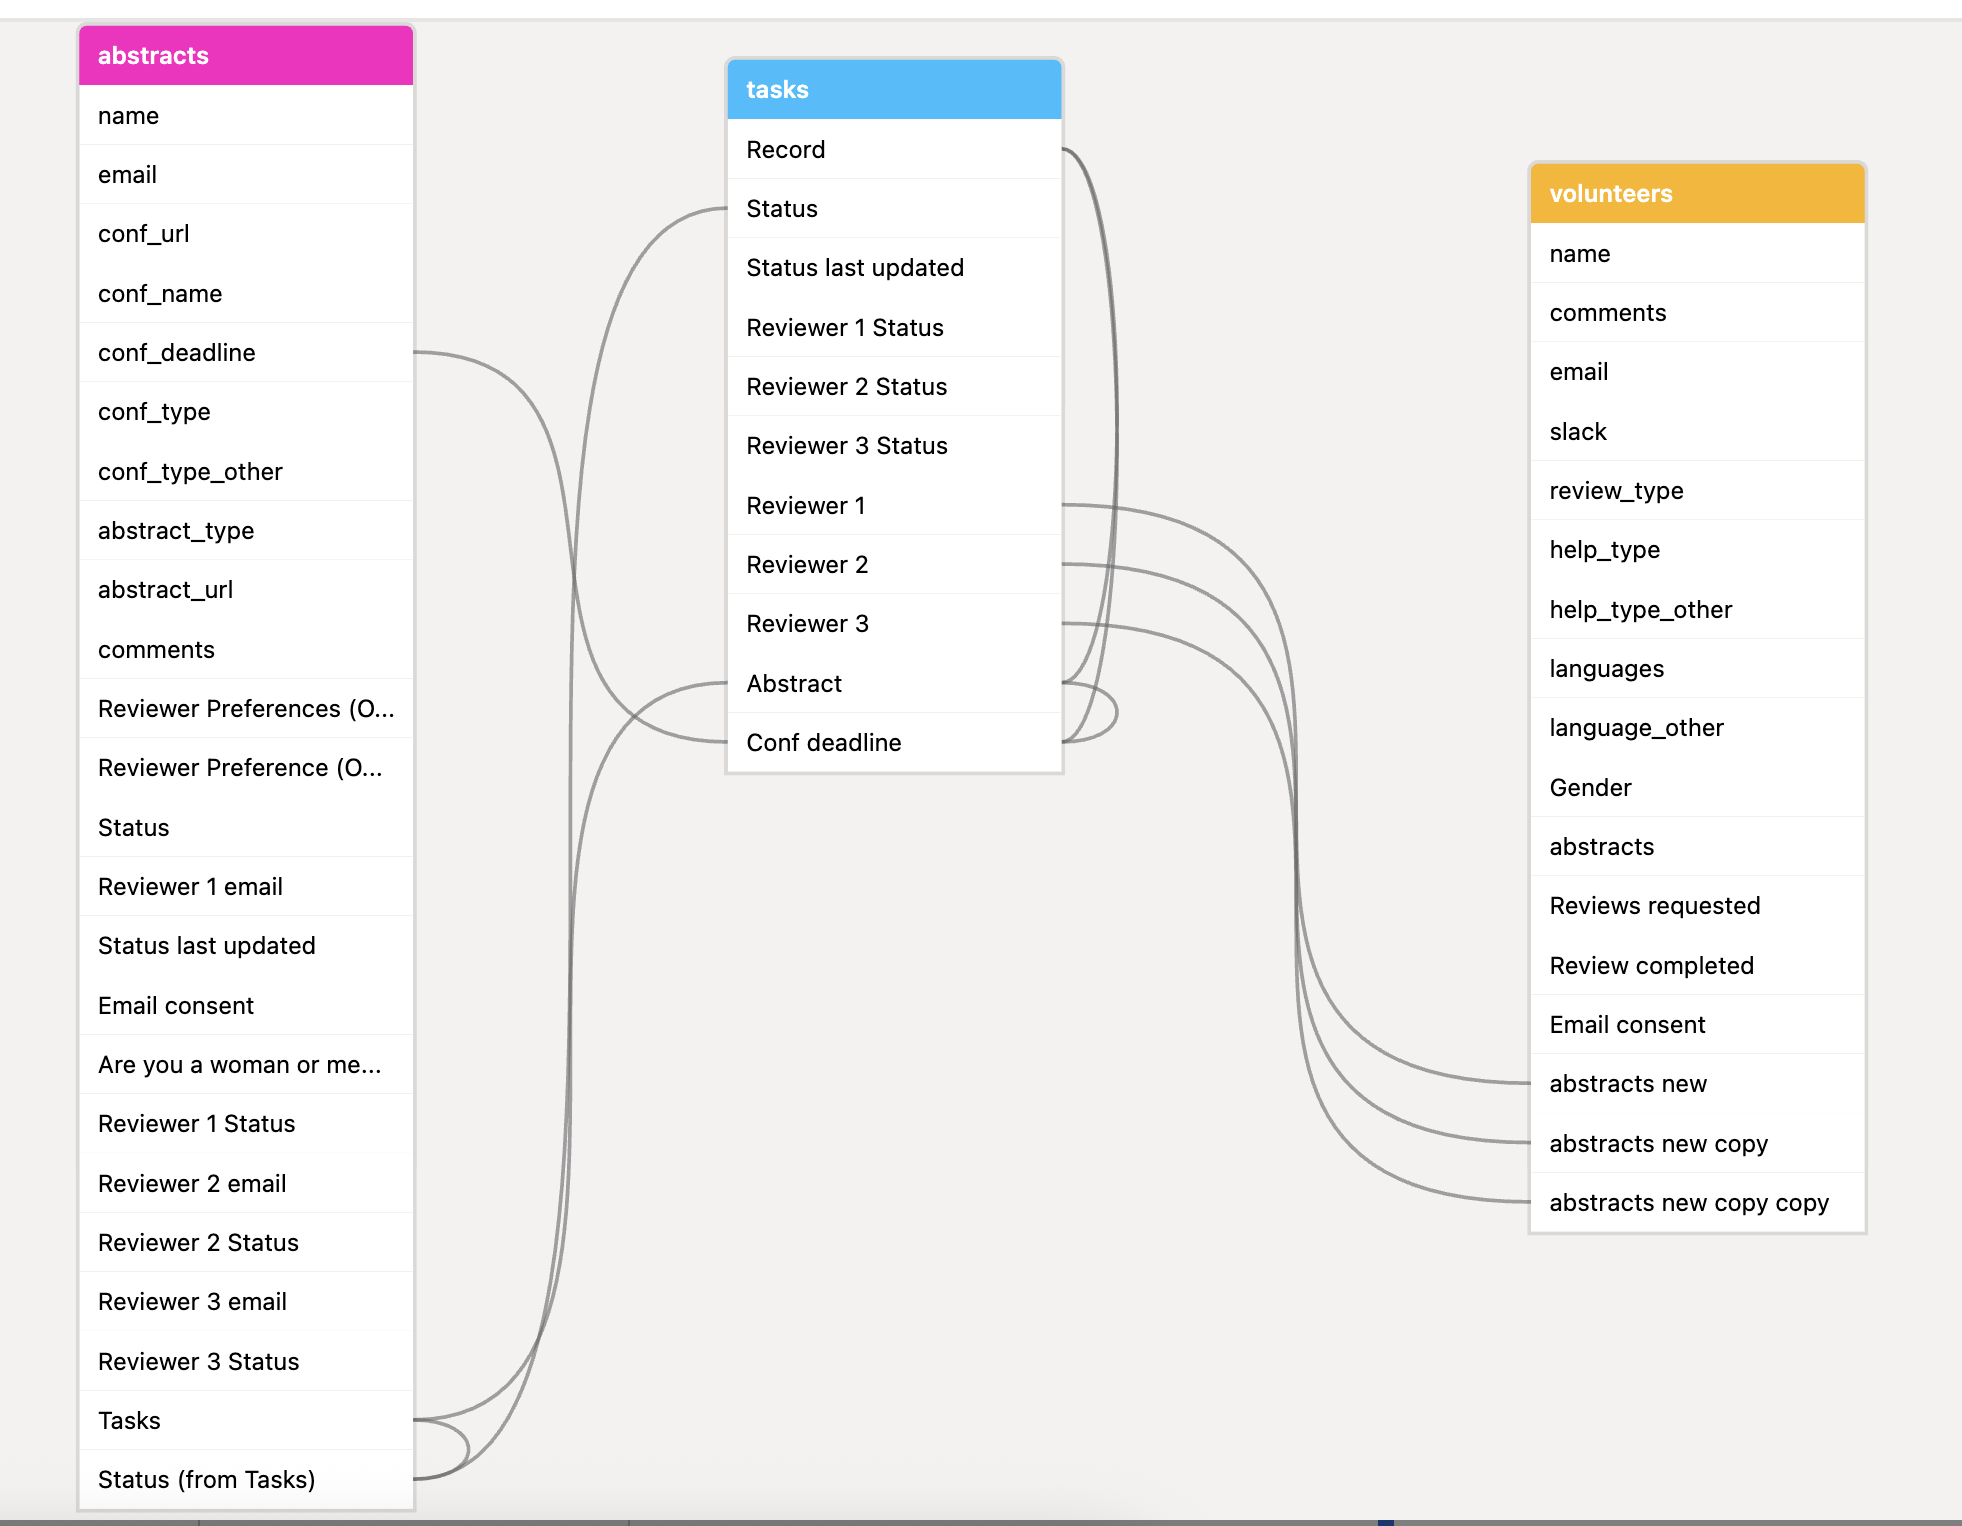
Notable Extension: Base schema
One particularly useful extension for understanding the structure of your Airtable bases is the Base schema extension. This extension provides a visual overview of all the tables within your base and, crucially, illustrates how these tables are connected through linked record fields. By visualizing these relationships, you can gain a clearer understanding of your database design, making it easier to navigate and manage complex bases. The Base schema extension is invaluable for documentation purposes and for onboarding new team members to an existing Airtable setup.
Accessing and Using Extensions
You can access and add extensions to your Airtable base by clicking on the “Extensions” button located in the top right corner of your base. This will open the Extensions panel, where you can browse the Marketplace, install new extensions, and manage the extensions already added to your base. Many extensions offer configuration options to tailor their functionality to your specific data and workflows.
By leveraging the power of Extensions, you can significantly expand the capabilities of your Airtable bases and create more efficient and integrated workflows for your team.
Exploring the Tools Menu in Airtable
The “Tools” menu in Airtable, typically found in the top right corner alongside the “Share” and “Extensions” buttons, offers a collection of utilities and features to help you manage your base. These are simple tools to help you manage the tables and records in the base in various ways.
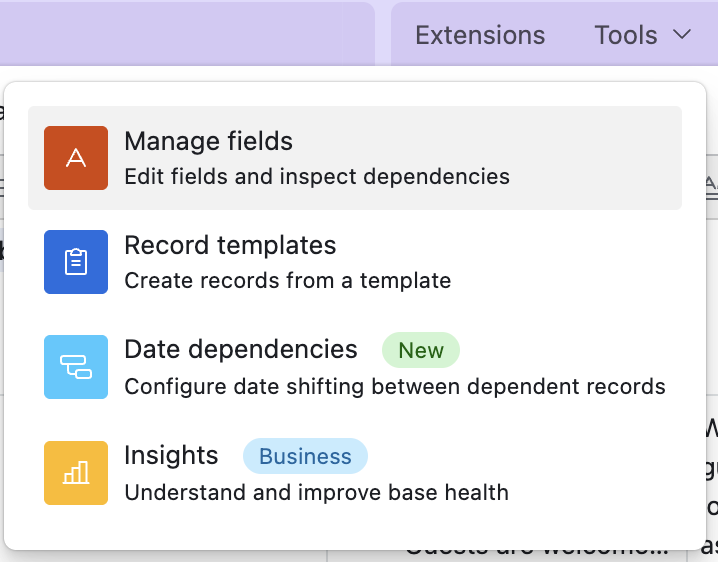
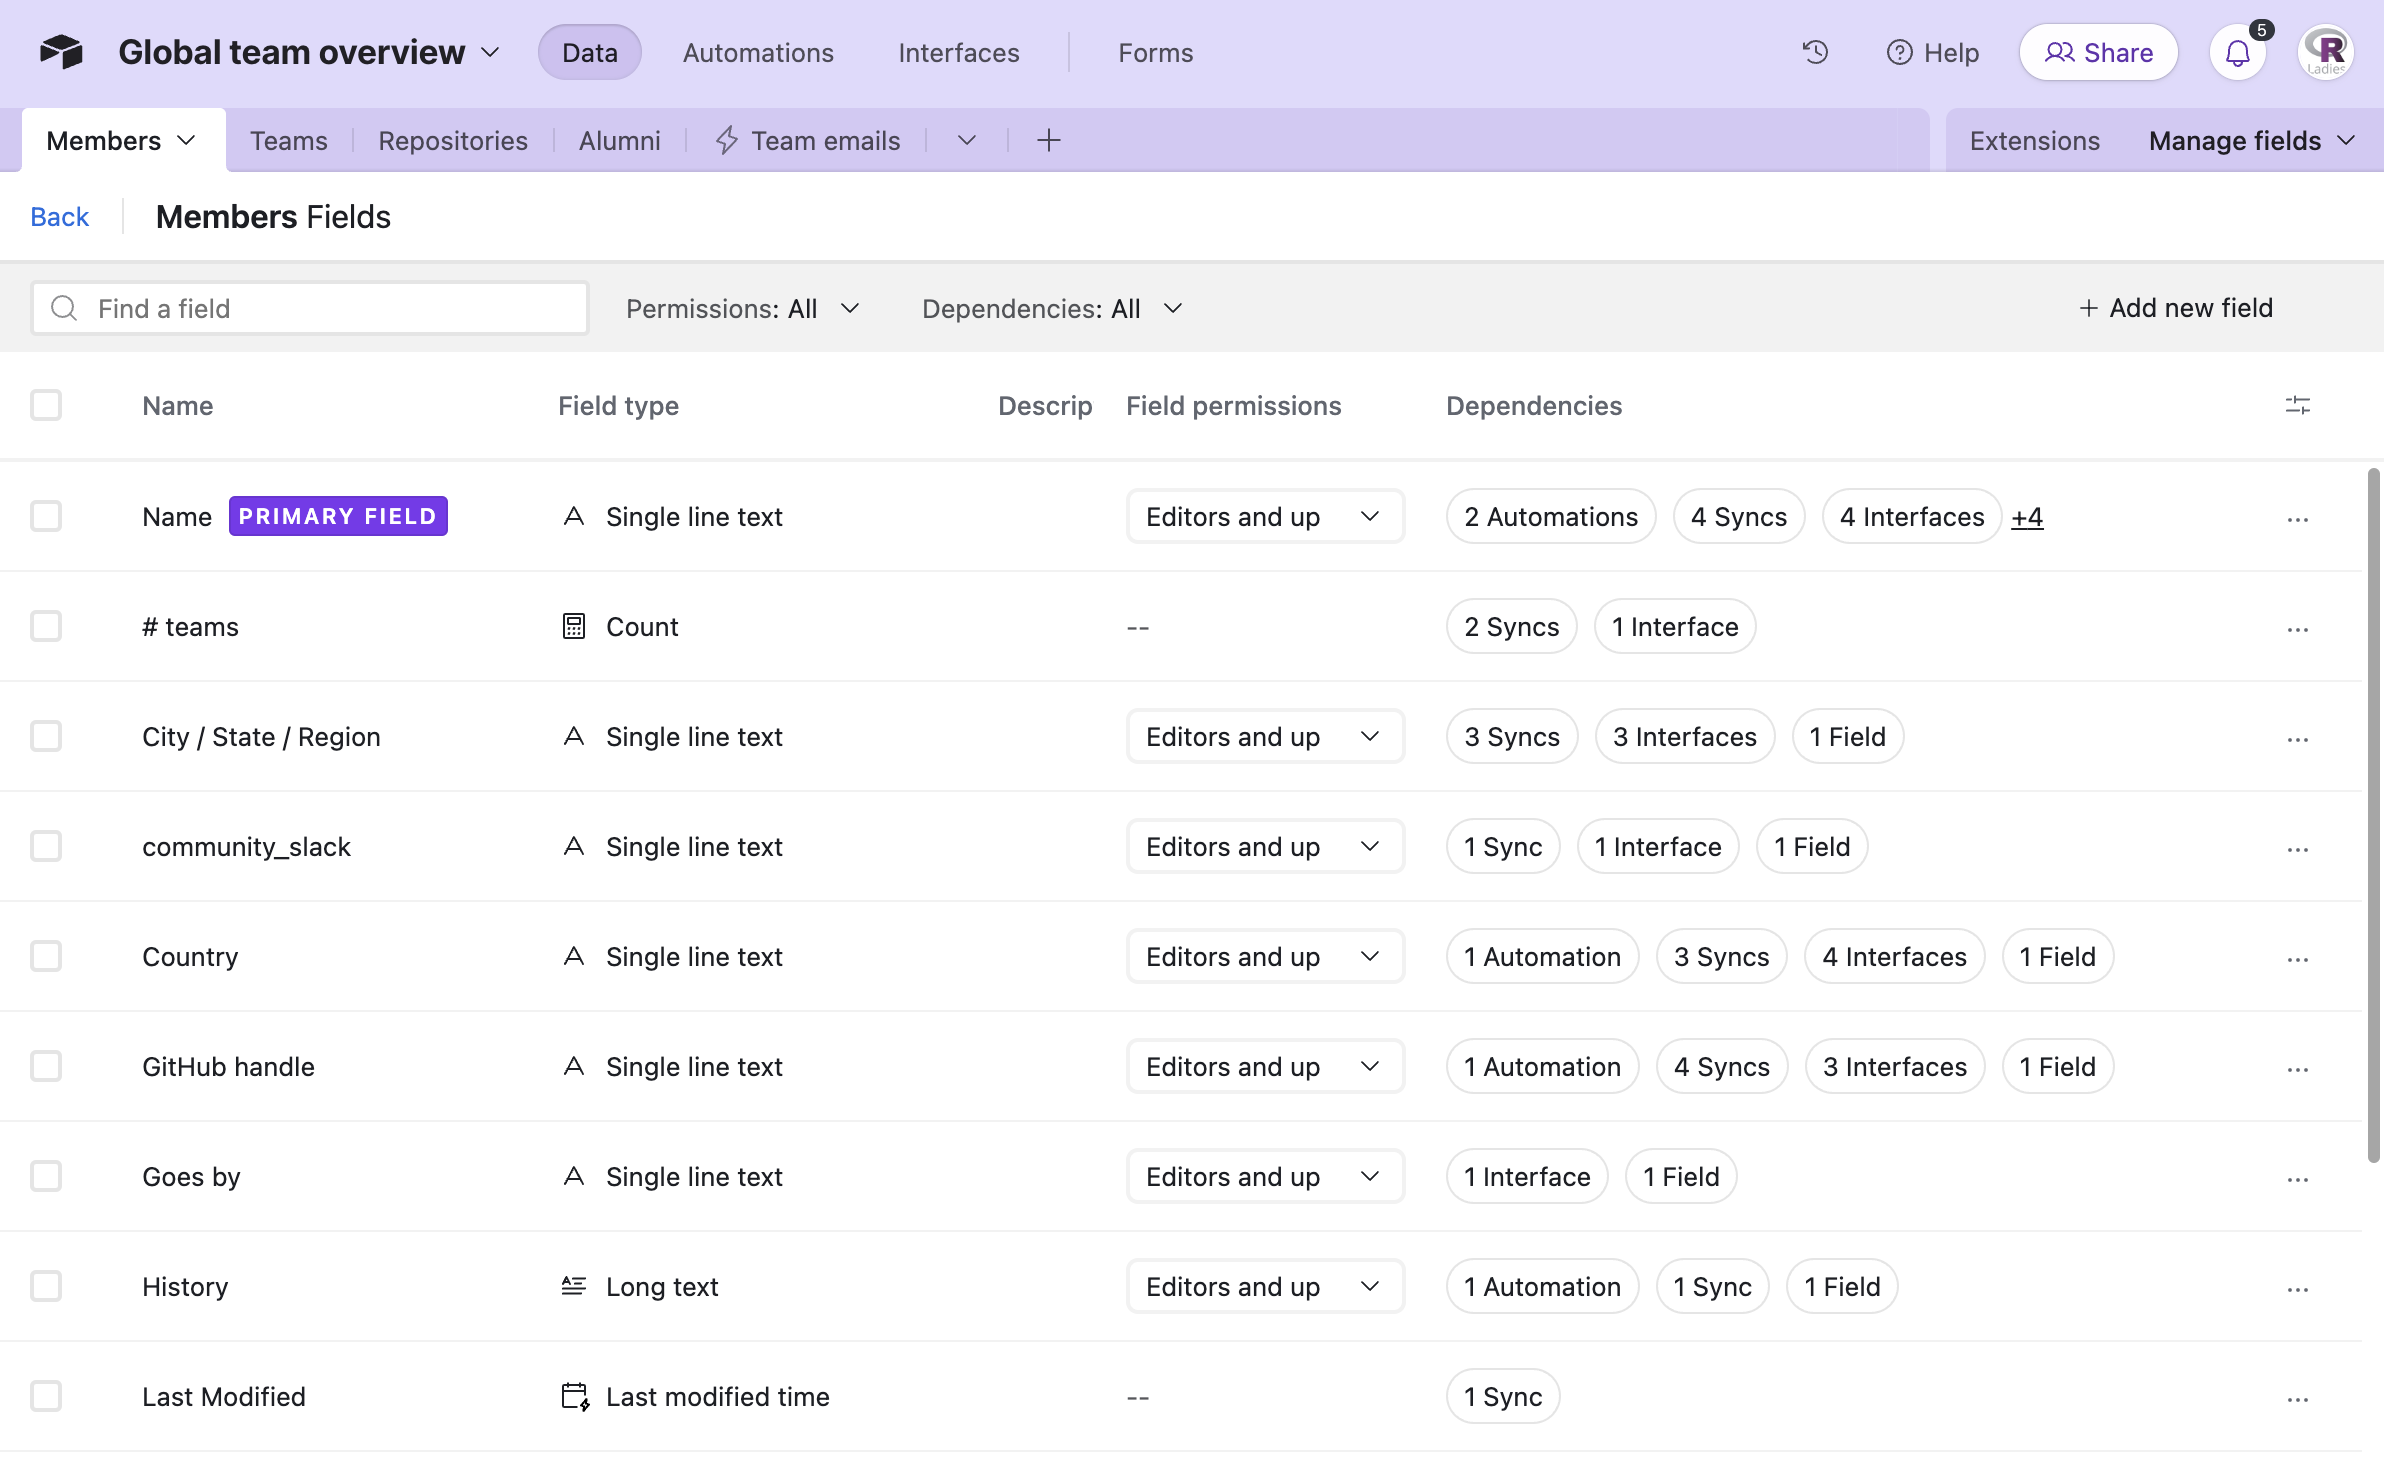
Manage fields
This tool allows you to edit the settings of your existing fields and inspect field dependencies. Understanding field dependencies is crucial for making changes to your base structure without unintentionally breaking formulas, lookups, or other connected elements. This tool likely provides a visual way to see which fields are used in formulas, lookups, rollups, and linked records throughout your base.
Record templates
With “Record templates,” you can create pre-filled templates for new records. This is incredibly useful for ensuring consistency and saving time when adding records that frequently share the same information. You can define default values for specific fields within a template, and then easily create new records based on these templates.
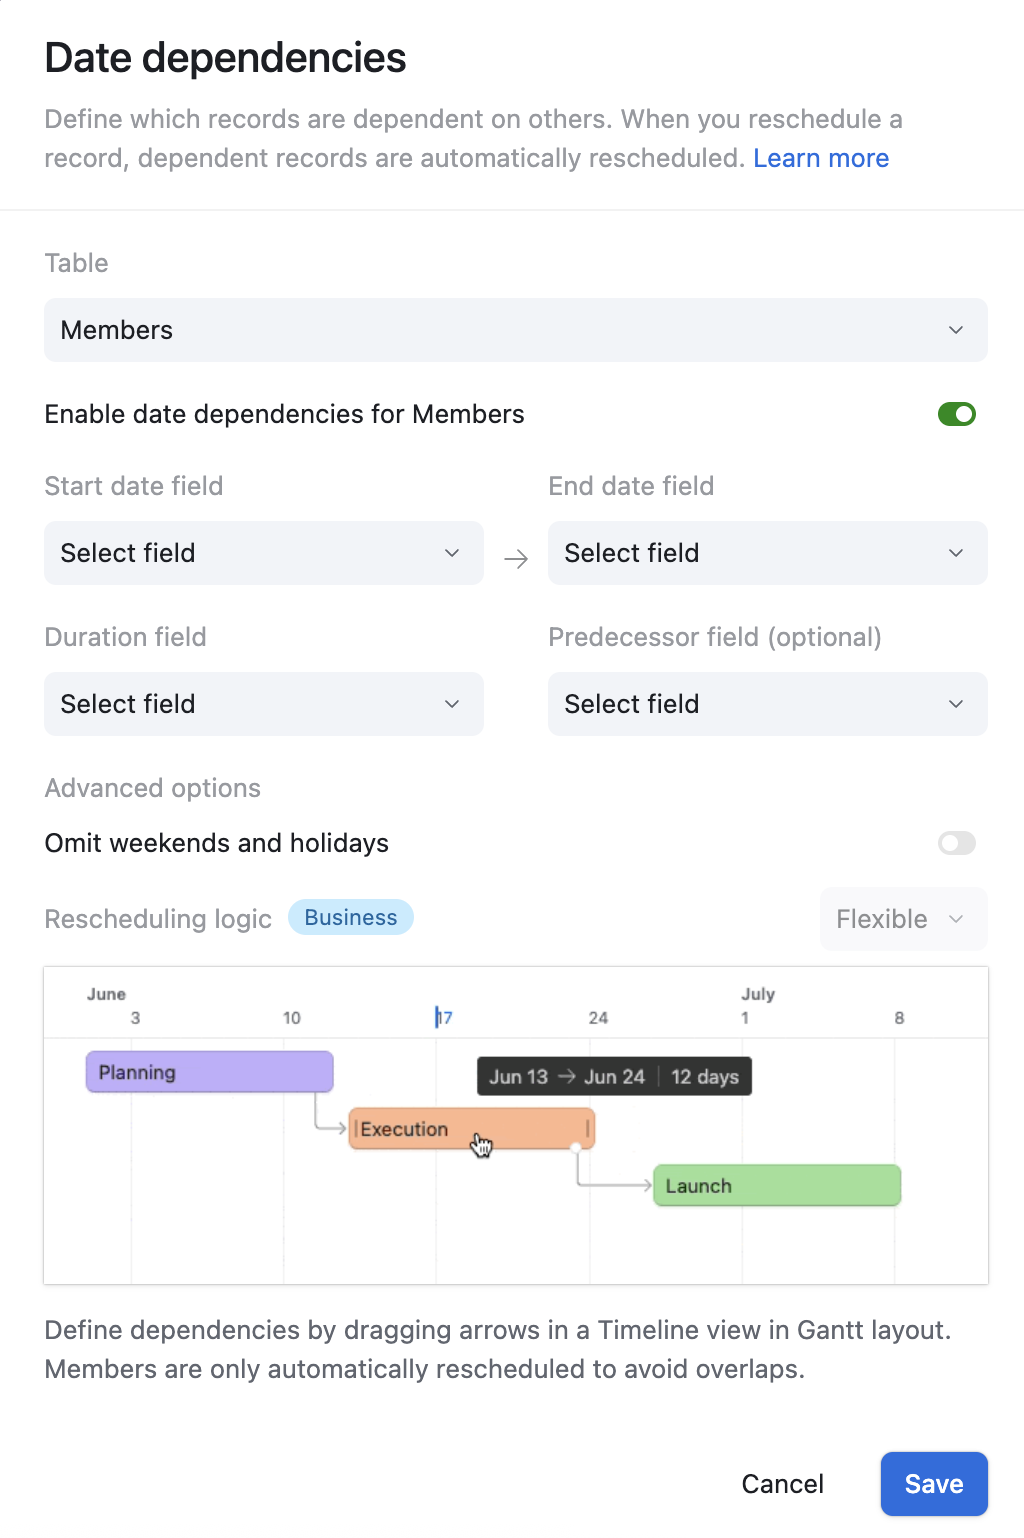
Date dependencies
This newer tool helps you configure how dates shift between dependent records. If you have records with dates that are related (e.g., a project start date and dependent task due dates), this tool likely allows you to set up rules so that if one date changes, the related dates are automatically adjusted accordingly. This can be very helpful for project management and other time-sensitive workflows.
Final Tips
✅ Use structured field names (avoid special characters).
✅ Set up filters & views to organize data effectively.
✅ Automate repetitive tasks to save time.
✅ Use forms for easy data entry without messing up table structure.